

Table of Contents
Every couple of years, I see multiple articles about Linux market share suddenly dropping or rising within a few months, reaching new all-time highs or all-time lows. This might raise the question: Is the Linux market share growing or shrinking overall?
Well, it's difficult to say, because we don't have a good metric for it. However, we do have a few data sources, all of which could be taken into consideration.
Sometimes, articles refer to the Steam Hardware & Software survey, which asks a random sample of Steam users for their current platform, including the Operating System. Of course, that data is bound to be highly biased towards gamers, but it's nonetheless one indicator we could listen to.
Alternatively, some articles use StatCounter's data, which tracks pageviews from supported websites and tells us which percentage claims to be coming from which Operating System. This is meant to be a bit more reliable, as it samples from billions of page views, but it still might introduce some biases.

ZDNet even ran an article claiming that Linux had 6% market share according to US government records, which might surprise some of you. Though obviously biased in favor of the US, we do have the analytics from the government's AdSense account, which is yet another data point.

And there's even more: W3Counter has its own Operating System tracker, and then there's one from CloudFlare, and we could even go looking at the StackOverflow yearly survey of developers, and so on…
It might be hard to keep track of every single thing. However, after looking at the data, I can tell you that Linux market share is, sadly, not stonks. (Or at least, it's not growing noticeably in the last couple of years.)

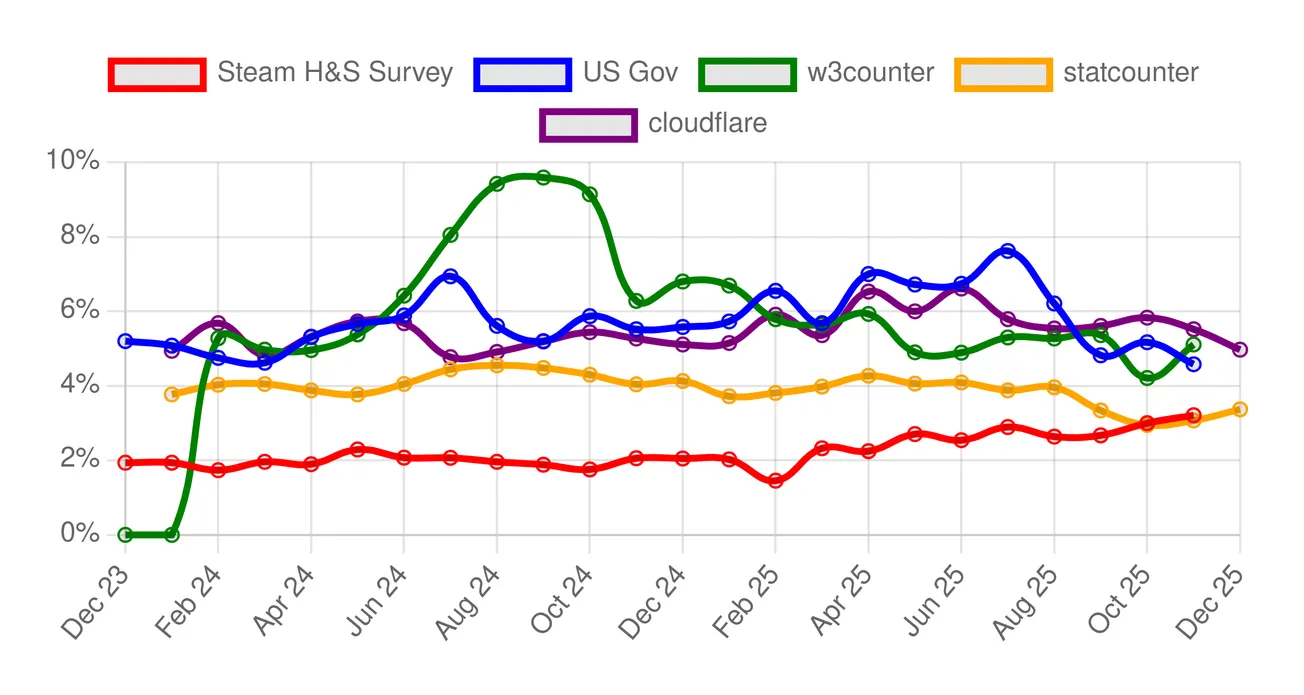
Here's the aggregated data of all of these data sources over the last two years:
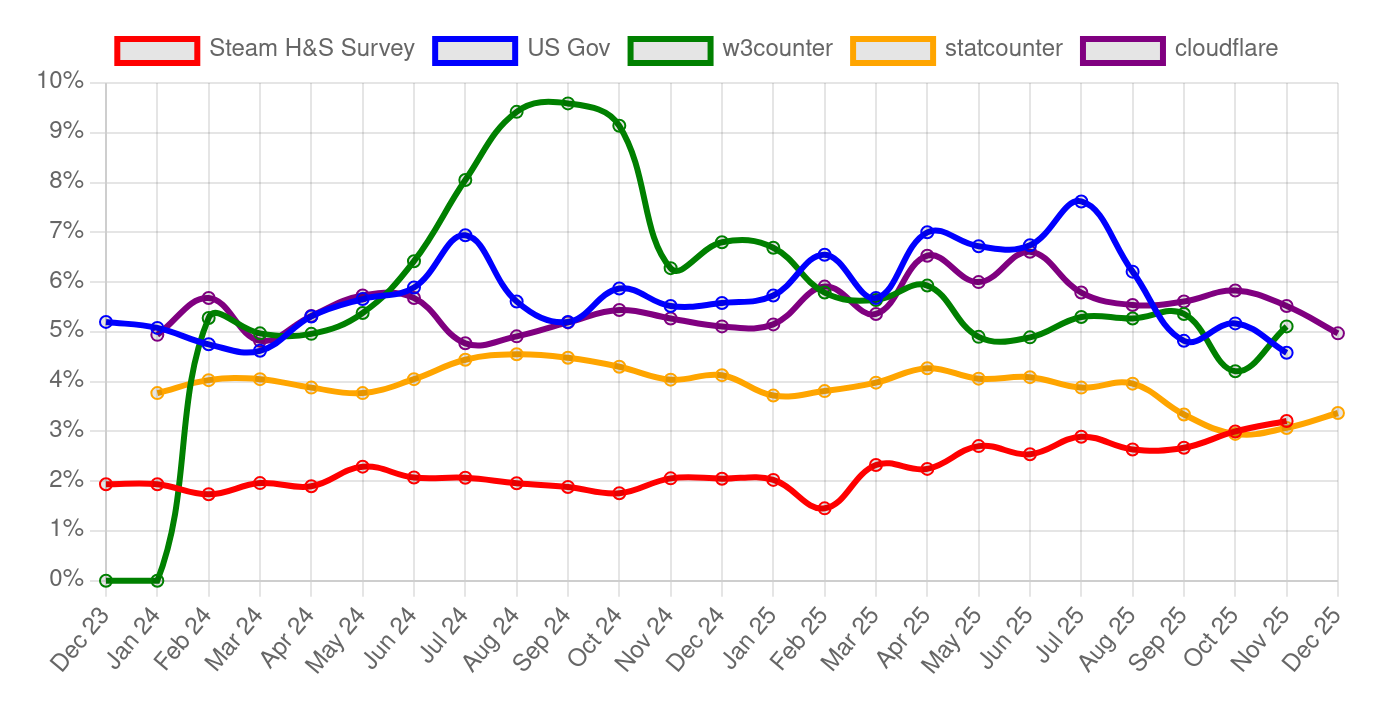
There are a few weird things about this graph, but I'll get through it.
Before that, I want to mention that this graph (and many more) can be found on the page thelibre.news/linux-marketshare, continuously updated for everyone to see. It took quite a while to automate grabbing data from all of the different sources and building the graphs automatically, so go give it some love!
Now, overall, I believe that we can safely say that there's no visible upward trend in Linux market share. The only datapoint showing a stable increase is the Steam H&S Survey, which is probably driven by Steamdeck sales (thanks, Valve!).
It's also worth noting that W3Counter data is unusually high and unusually low on different time frames. That's because that website only provides the top 10 most used Operating Systems, including both desktop and mobile ones. When Linux doesn't make the top 10, I get no data, and I have to mark it as zero. However, I don't have a good explanation for why it was giving such high numbers around Sept '24!
On the webpage itself, you will find an in-depth explanation of every data source, and a graph for each one, too. I'm also working to bring more data than just the last two years, and to show geographical data, filtering by country.
Check it out:


